
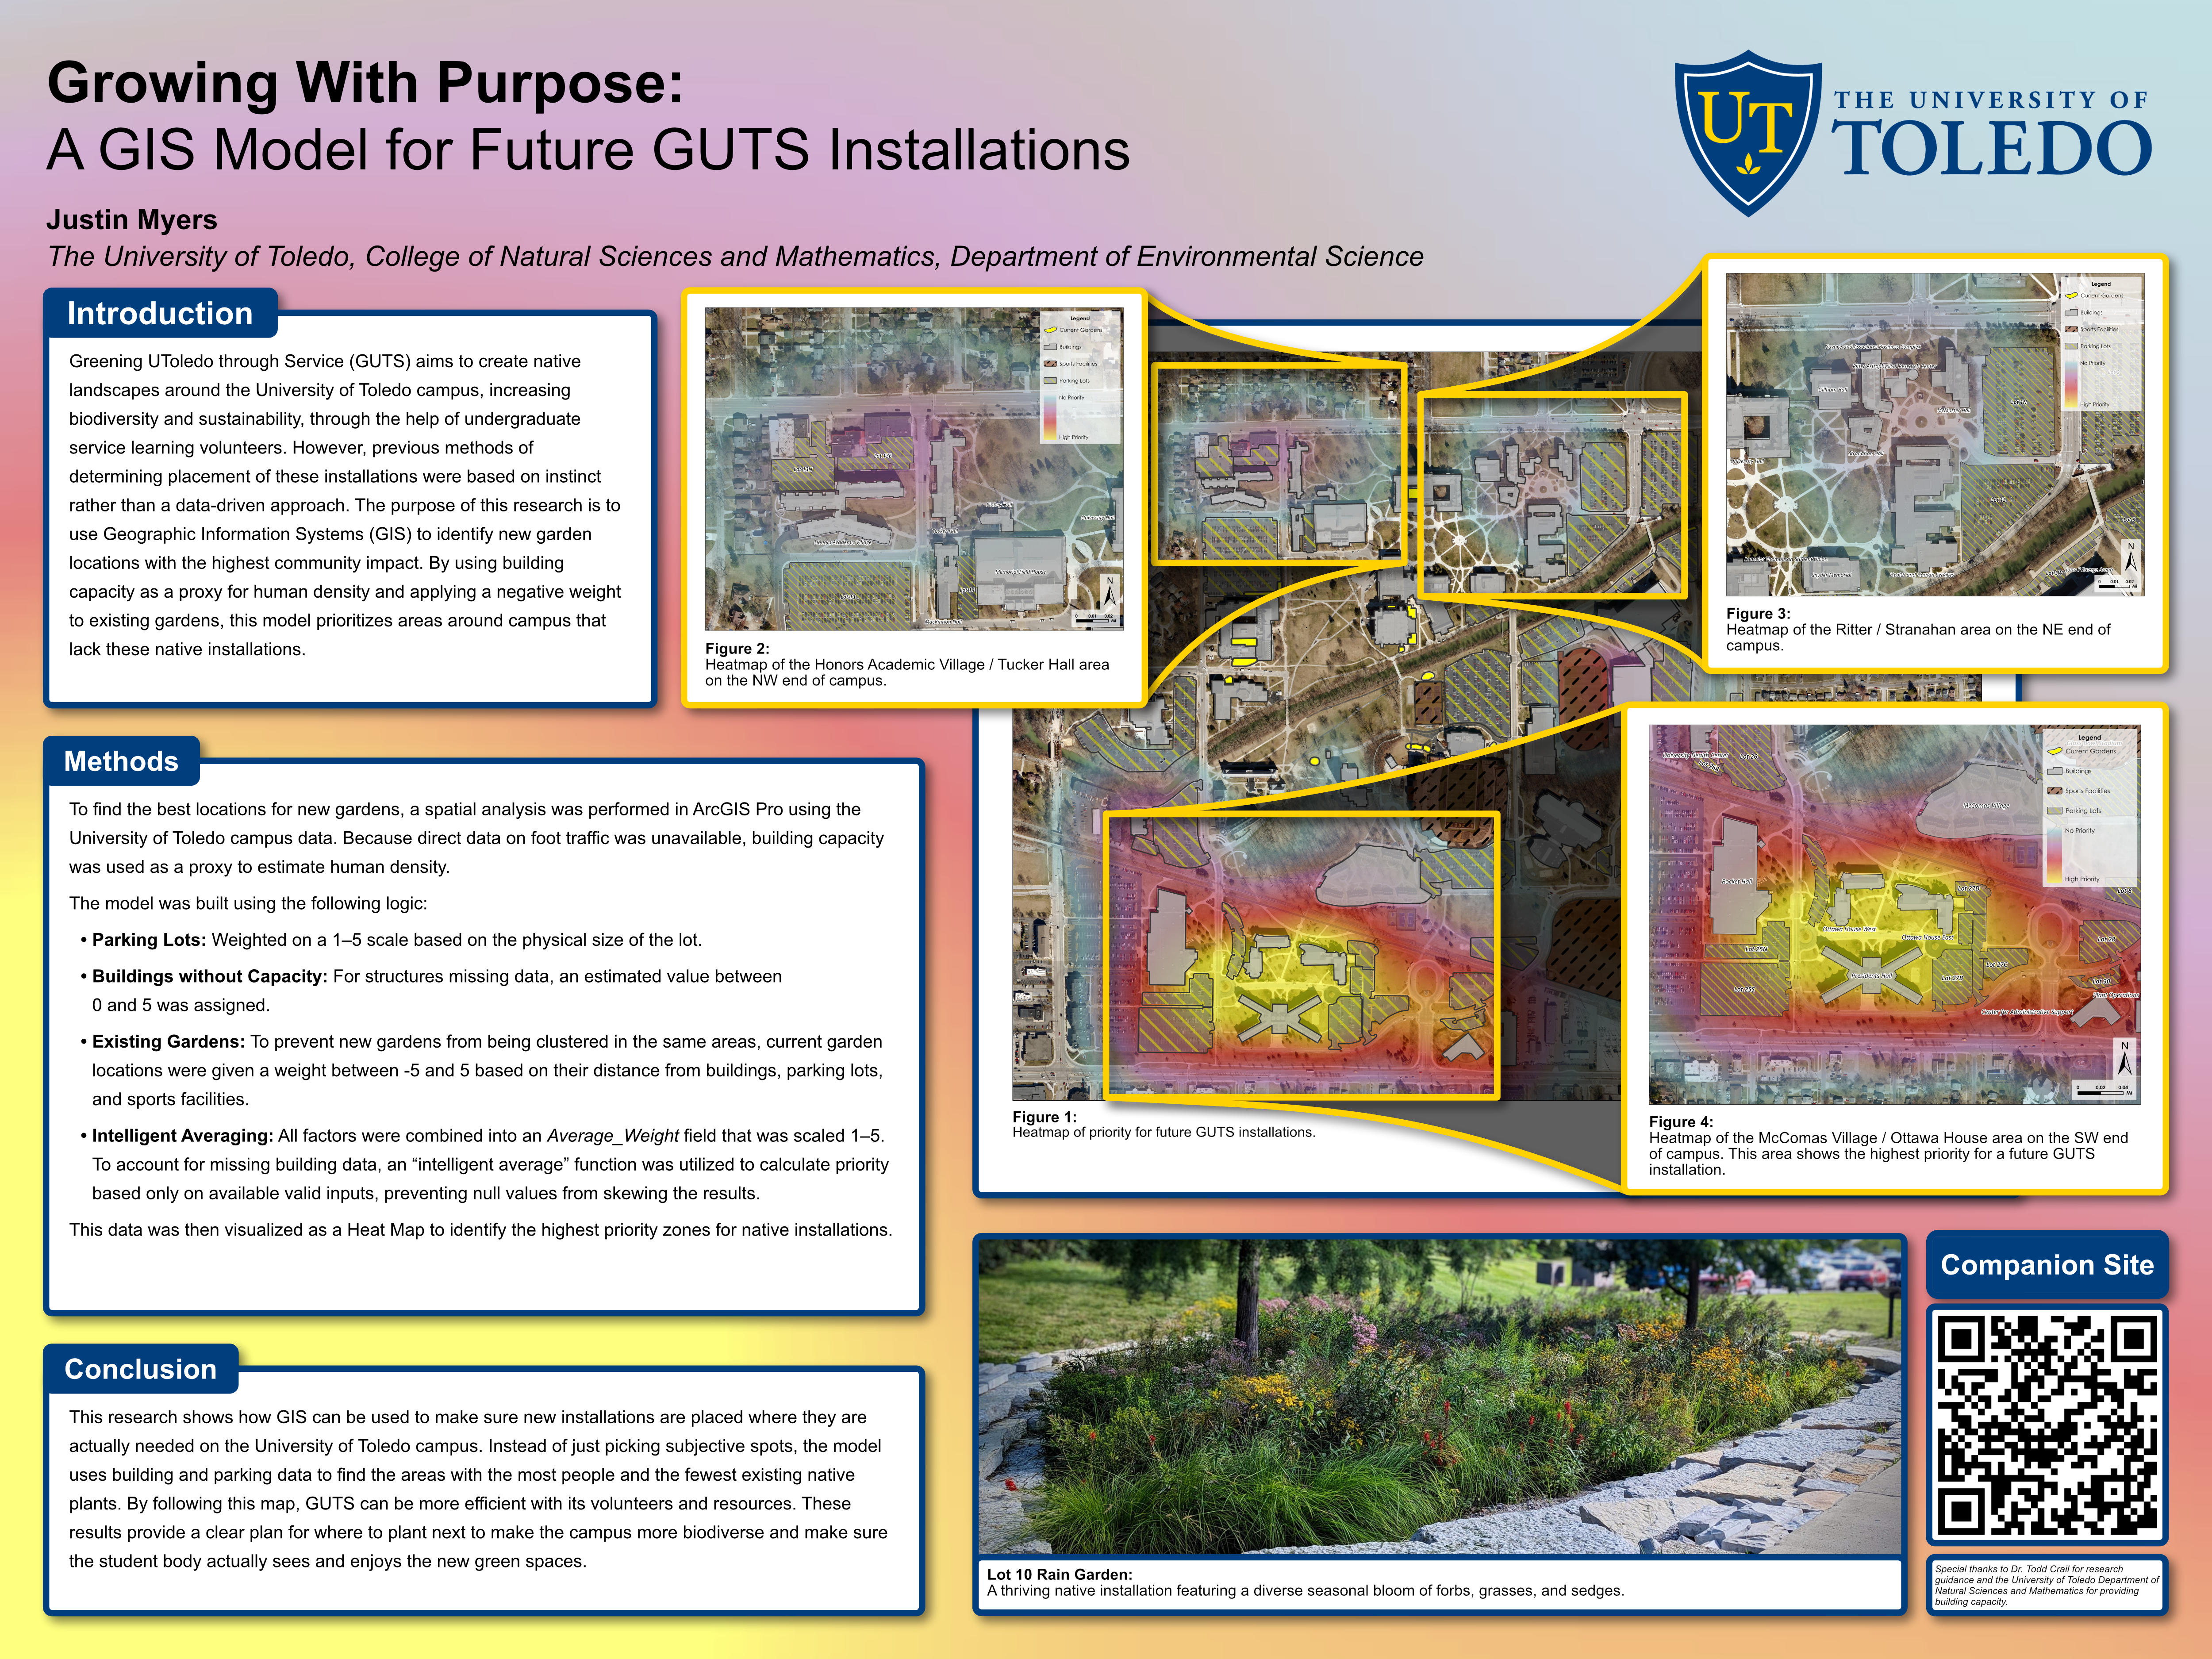
Growing With Purpose: A GIS Model for Future GUTS Installations
by Justin Myers
Downloads
Contents
Abstract
Native plant gardens on the University of Toledo campus not only provide essential habitat for wildlife and pollinators but also provide ecological benefits while simultaneously offering significant aesthetic value. Historically, however, garden placement has lacked a data-driven approach regarding visibility and engagement. This study utilizes Geographic Information Systems (GIS) to identify optimal locations for future Greening UToledo through Service (GUTS) installations by modeling foot traffic around campus. Since real-time pedestrian data was unavailable, building capacity was used as a proxy for foot traffic. Weighted values were applied to high-traffic areas such as parking lots, sports facilities, and buildings such as the Student Union & Carlson Library, while existing gardens were negatively weighted to prioritize underserved areas. The building capacity data provided by the College of Natural Sciences and Mathematics revealed three primary hotspot areas for potential development: Honors Village/Tucker Hall, Ritter/Stranahan, and McComas Village. These preliminary results demonstrate that a weighted GIS model can successfully identify high-impact locations, providing a framework that can be used for future GUTS gardens.
Introduction
GUTS aims to create native landscapes around the University of Toledo campus, increasing biodiversity and sustainability, through the help of undergraduate service learning volunteers. However, previous methods of determining placement of these installations were based on instinct rather than a data-driven approach. The purpose of this research is to use GIS to identify new garden locations with the highest community impact. By using building capacity as a proxy for human density and applying a negative weight to existing gardens, this model prioritizes areas around campus that lack these native installations.
Methods
To find the best locations for new gardens, a spatial analysis was performed in ArcGIS Pro using the University of Toledo campus data. Because direct data on foot traffic was unavailable, building capacity was used as a proxy to estimate human density.
The model was built using the following logic:
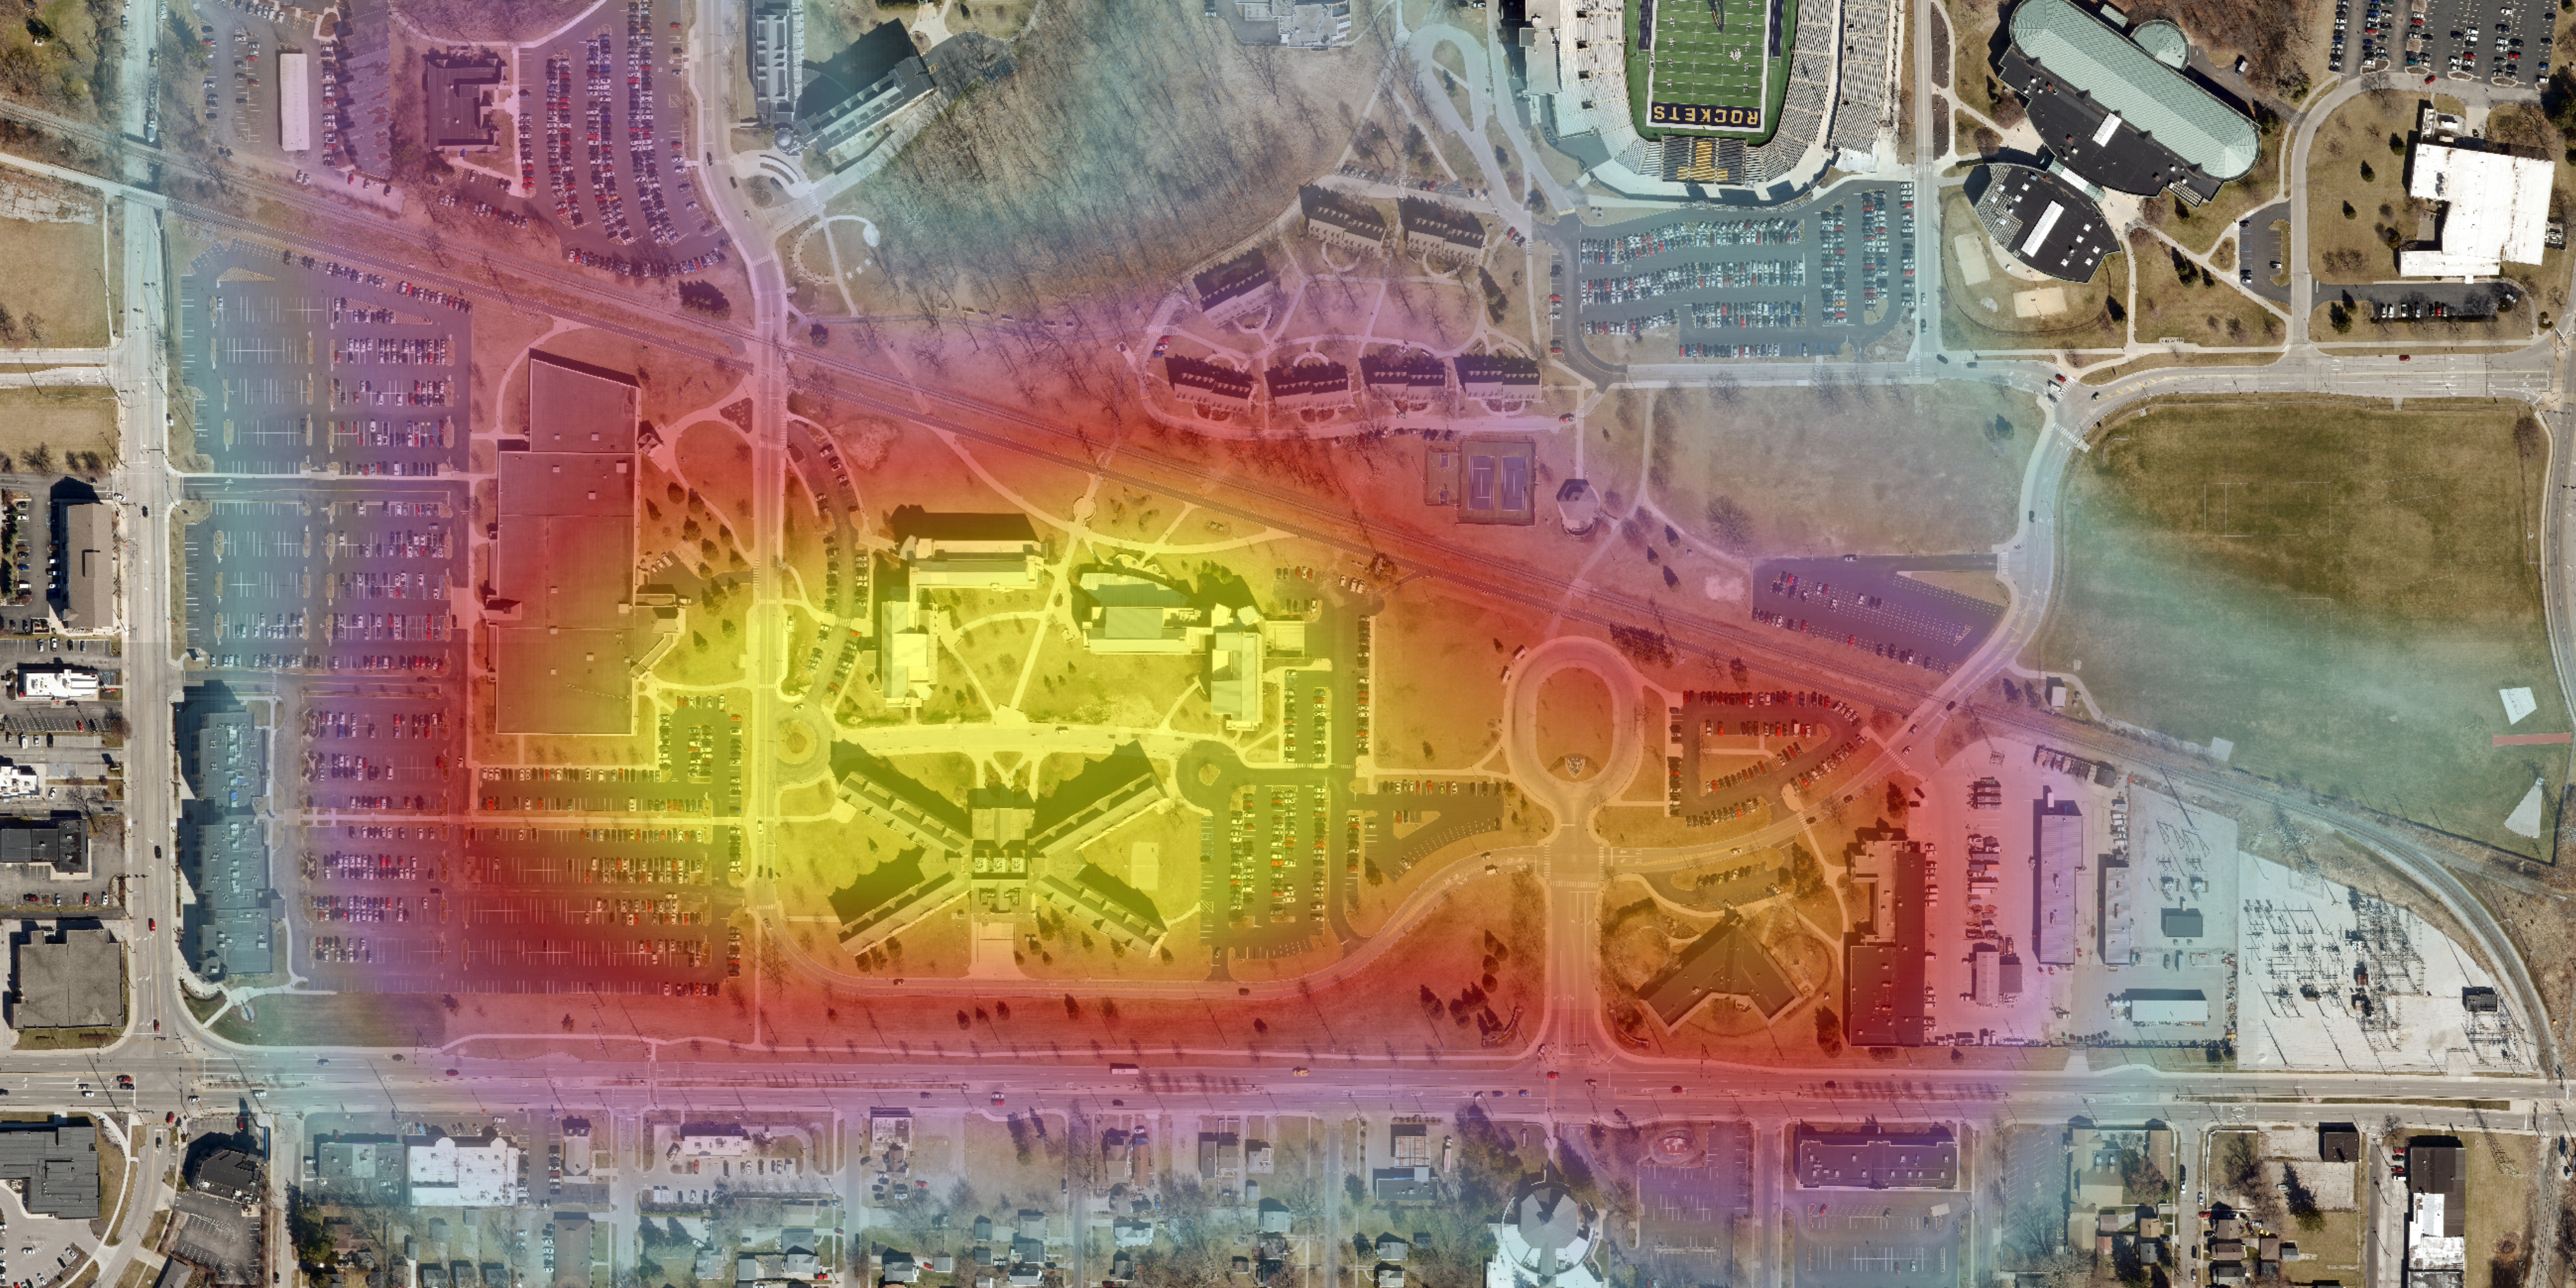
This data was then visualized as a Heat Map to identify the highest priority zones for native installations.
Conclusion
This research shows how GIS can be used to make sure new installations are placed where they are most needed on the University of Toledo campus. Instead of just picking subjective spots, the model uses building and parking data to find the areas with the most people and the fewest existing native plants. By following this map, GUTS can be more efficient with its volunteers and resources. These results provide a clear plan for where to plant next to make the campus more biodiverse and make sure the student body actually sees and enjoys the new green spaces.
Figures & Tables
Below are the figures and tables produced from this research. Clicking any image will make it larger.
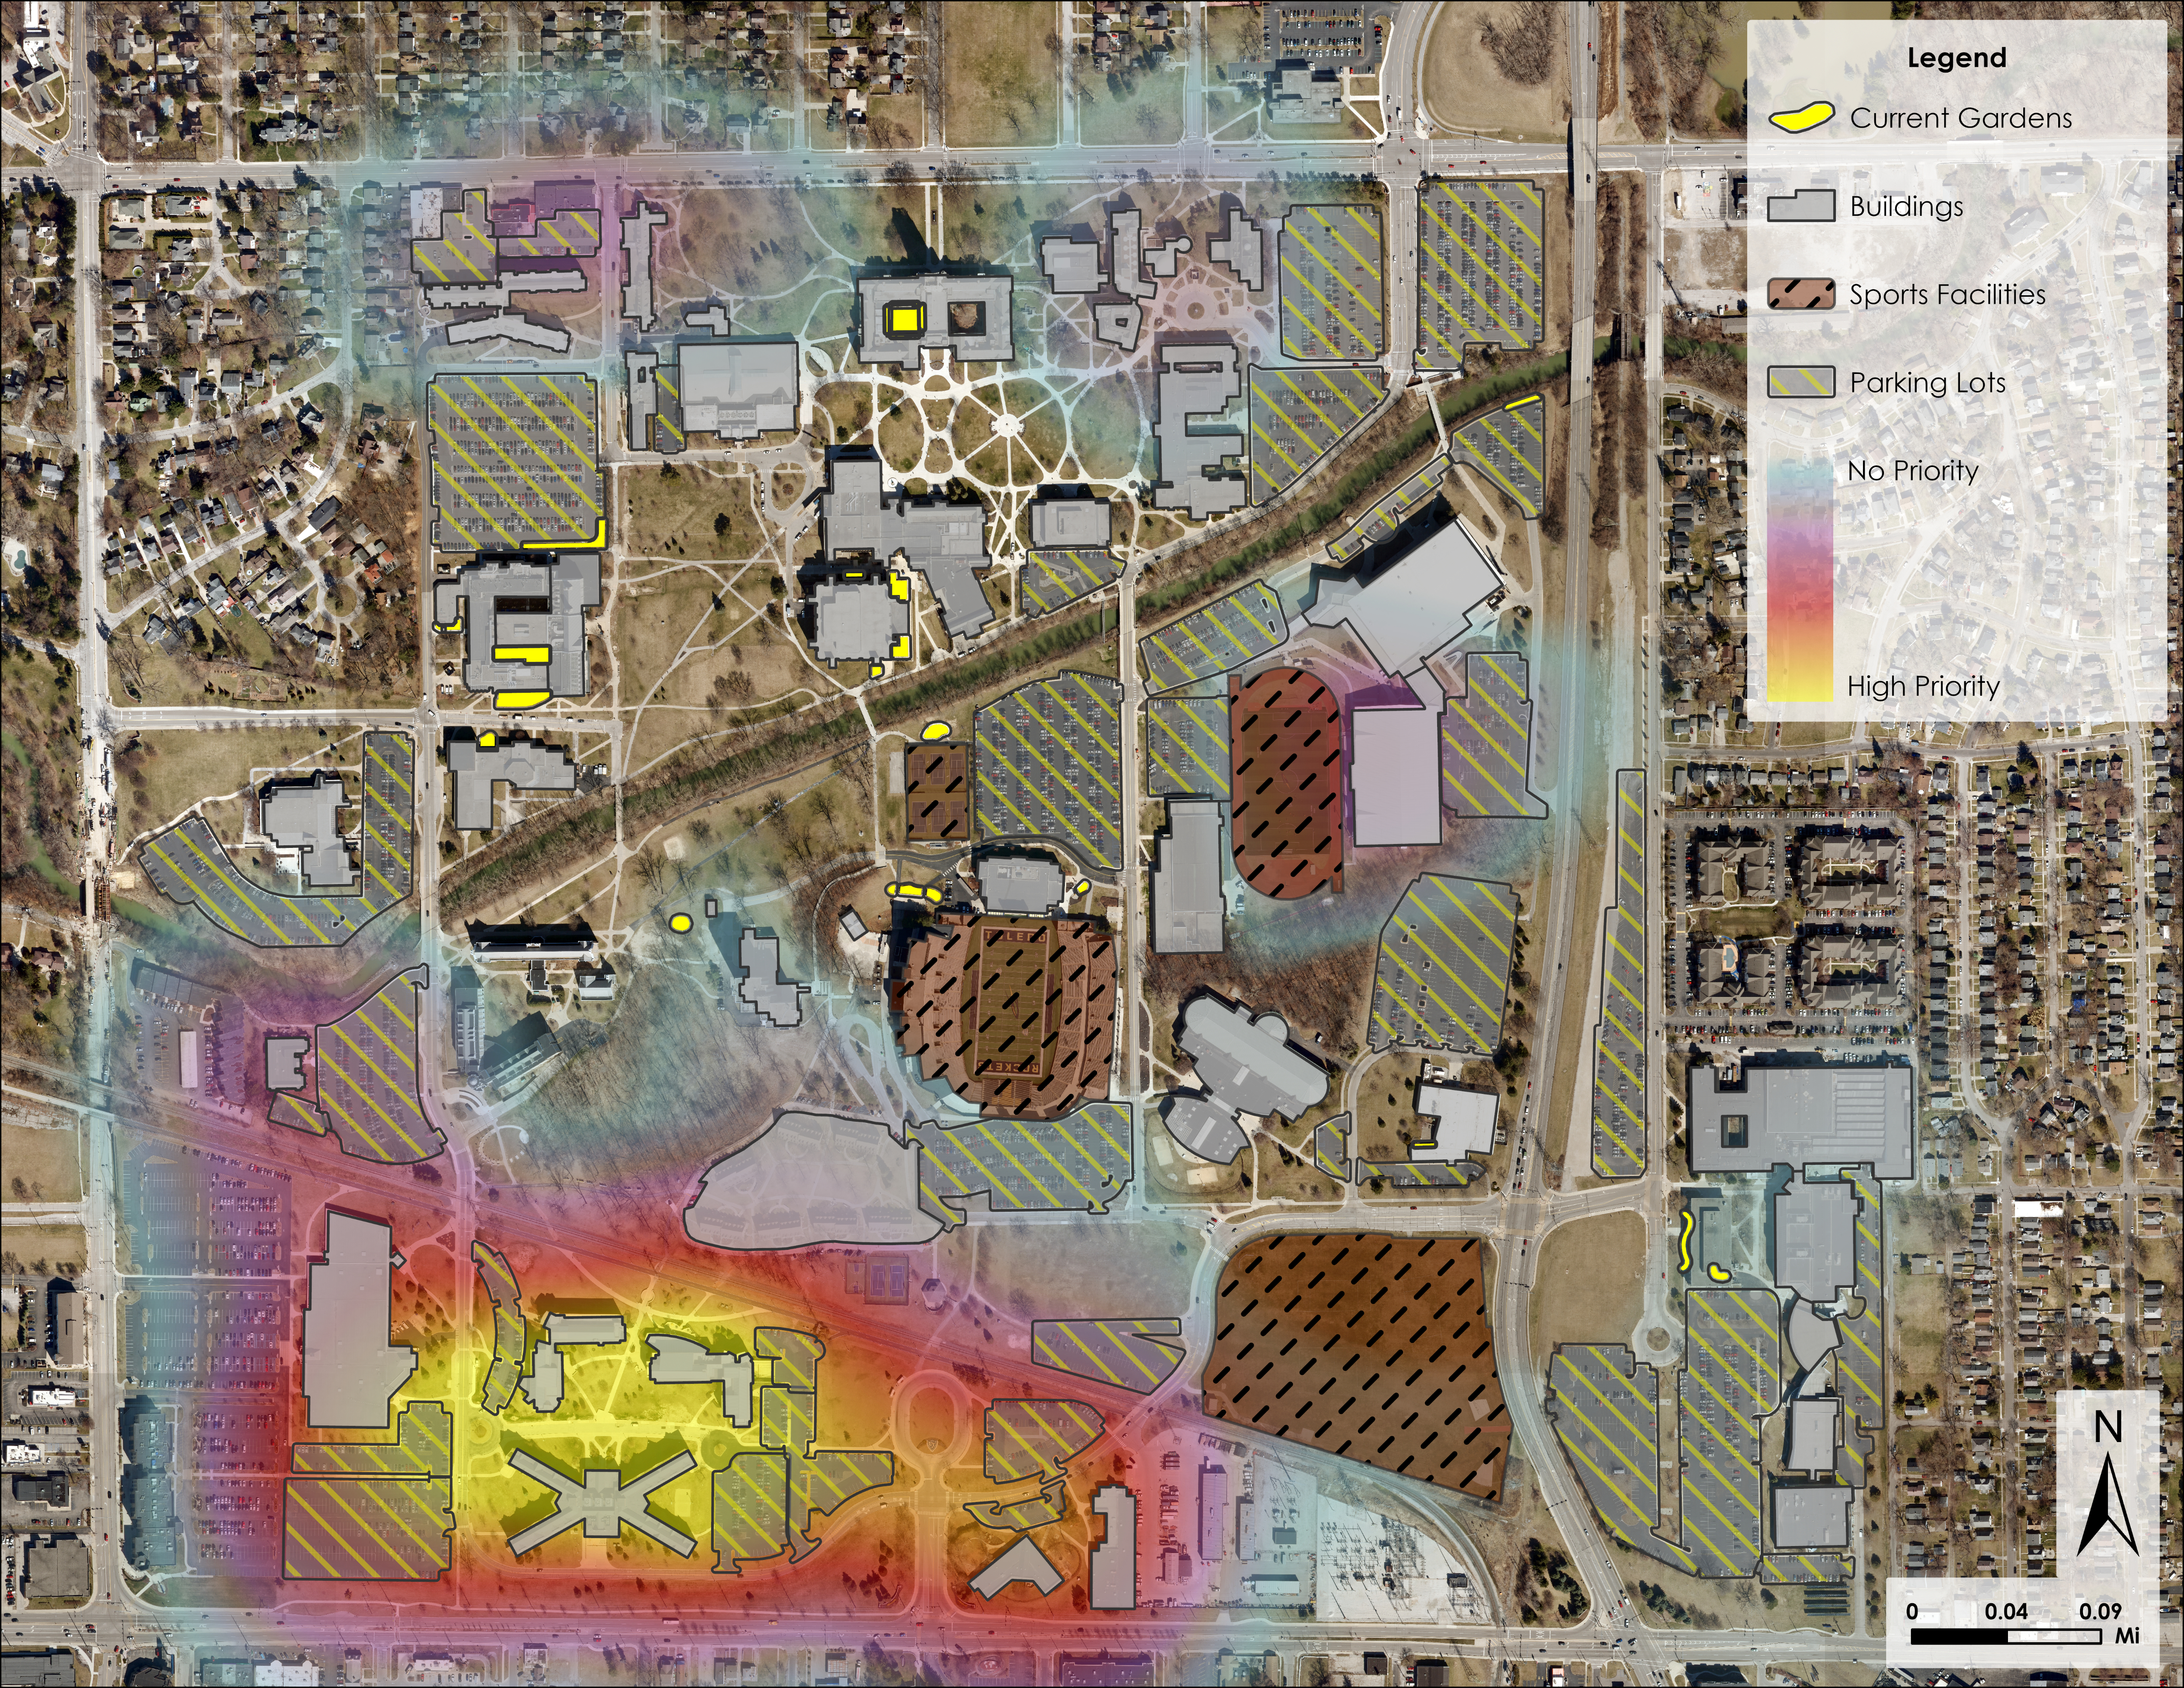
Figure 1. Overview of entire campus. The main hotspots can be seen in more detail below.
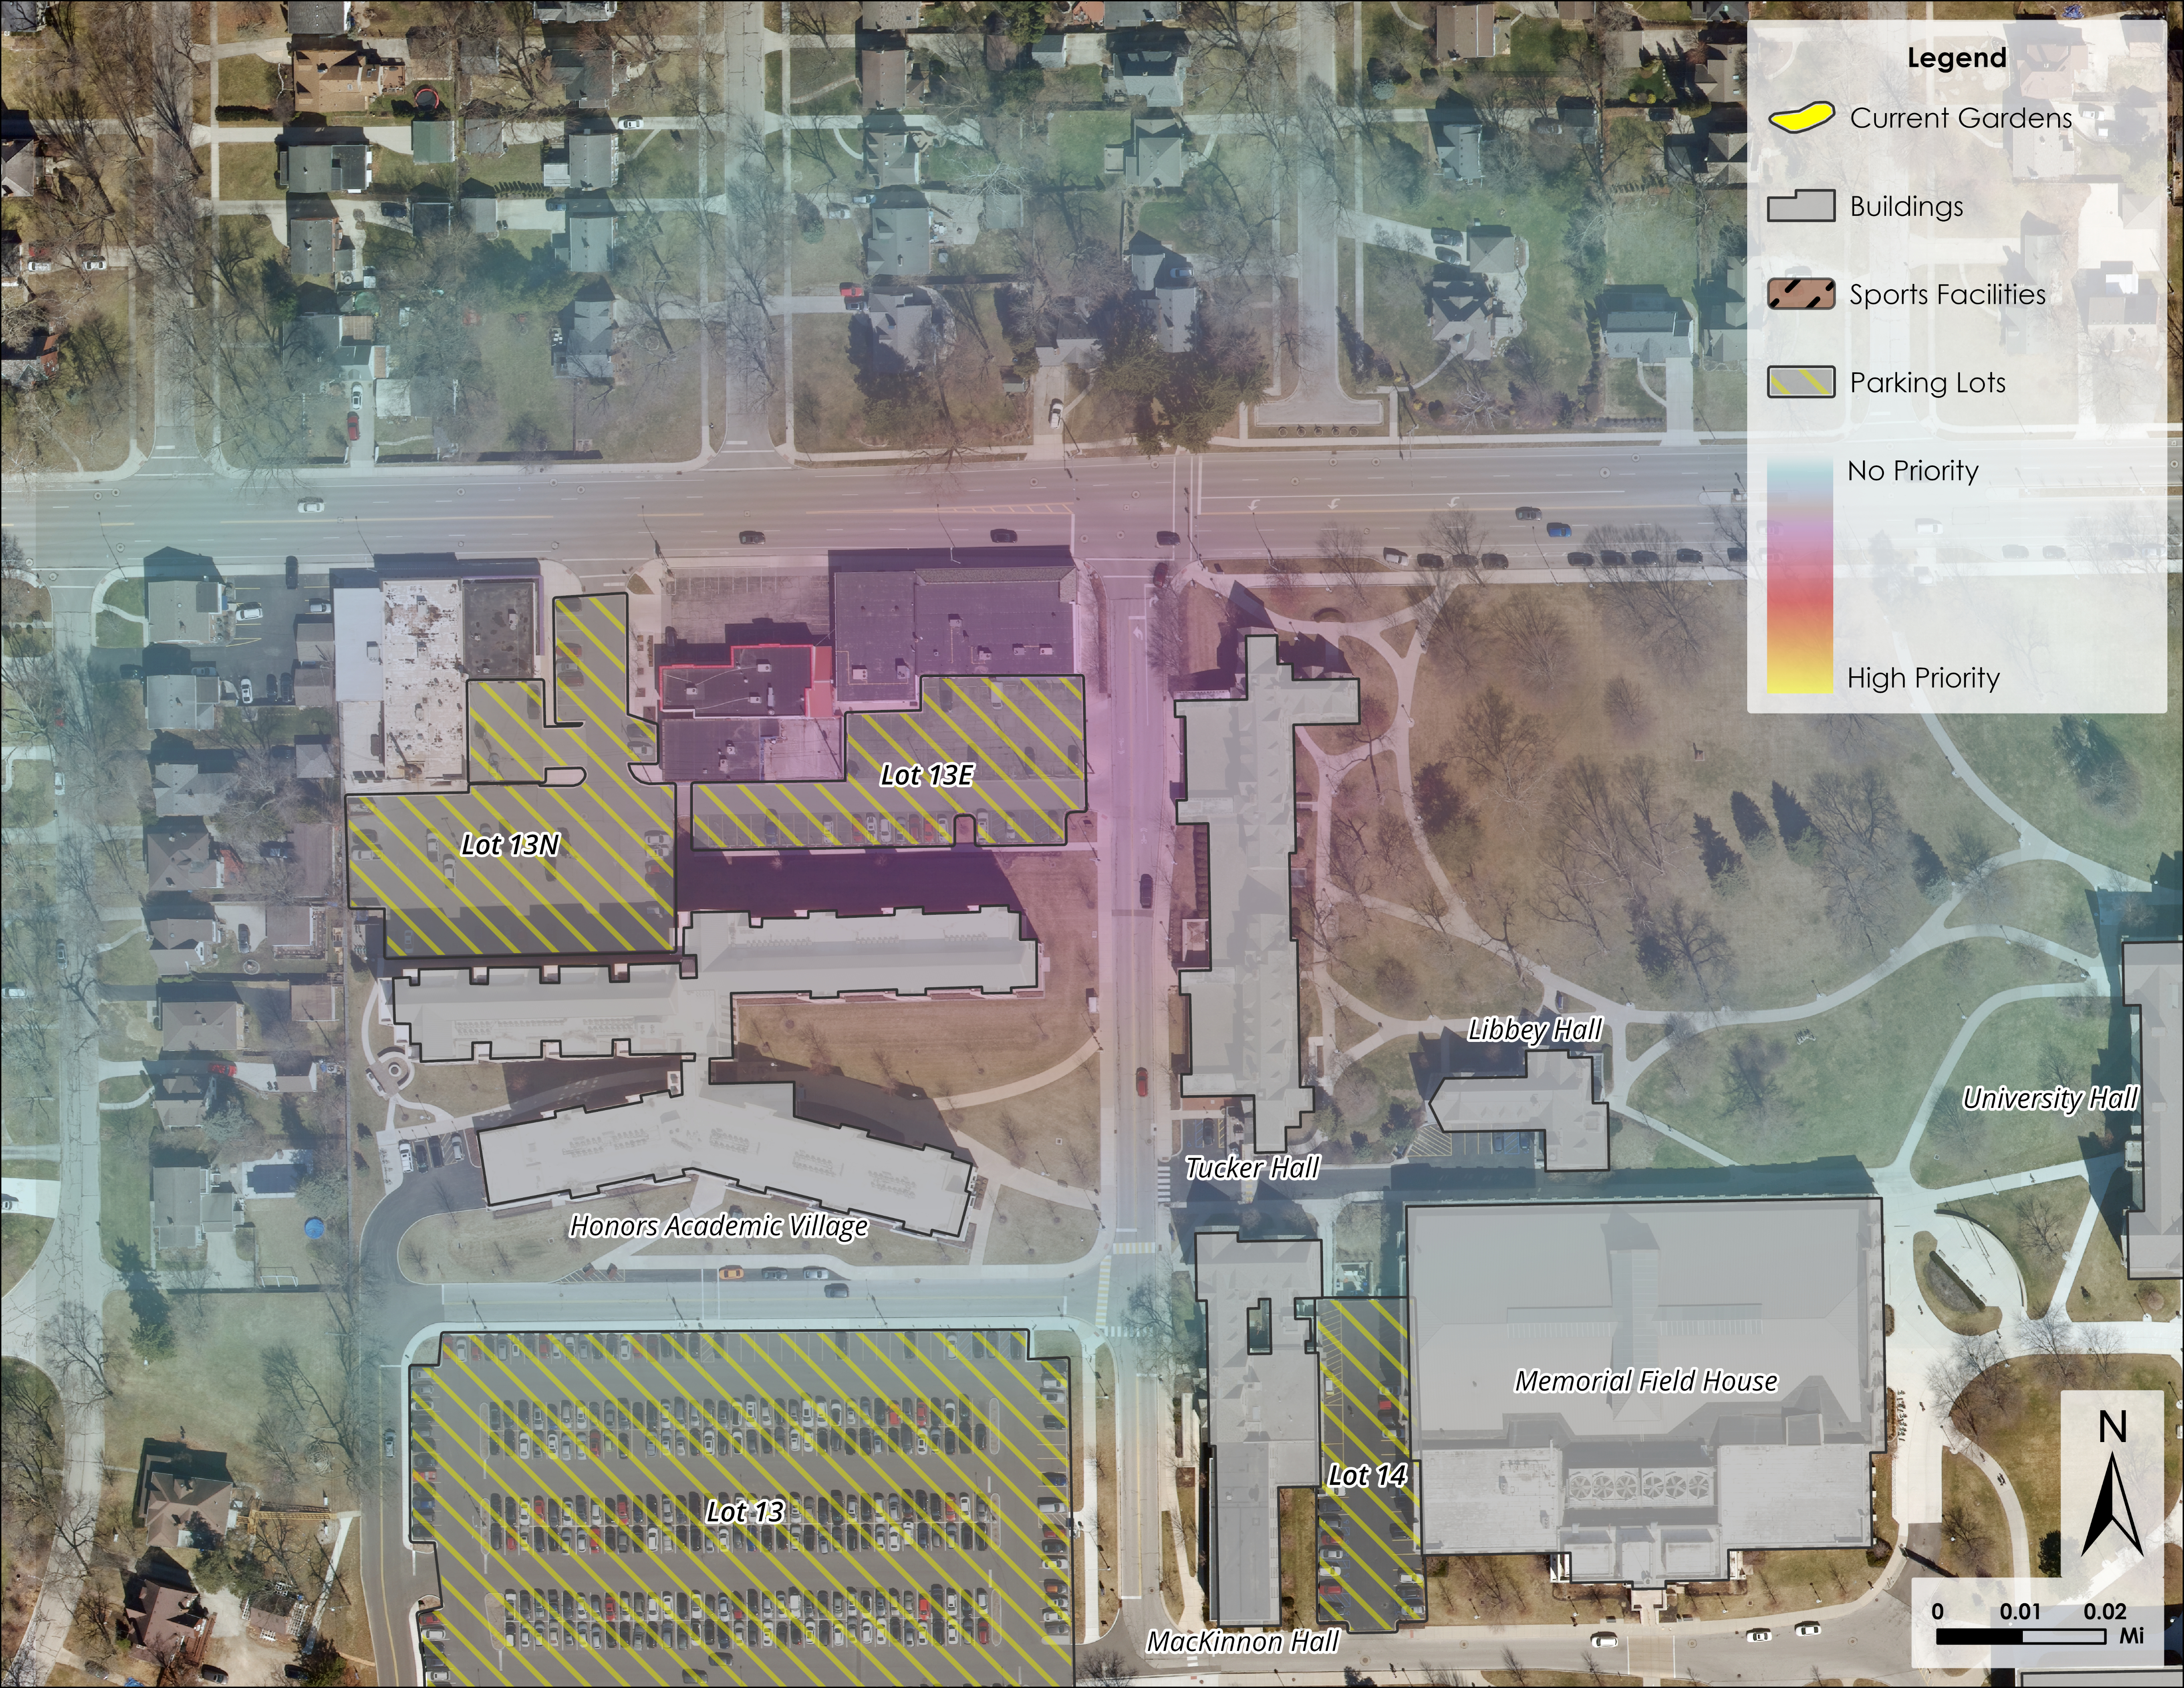
Figure 2. Heatmap of the Honors Academic Village / Tucker Hall area on the NW end of campus.
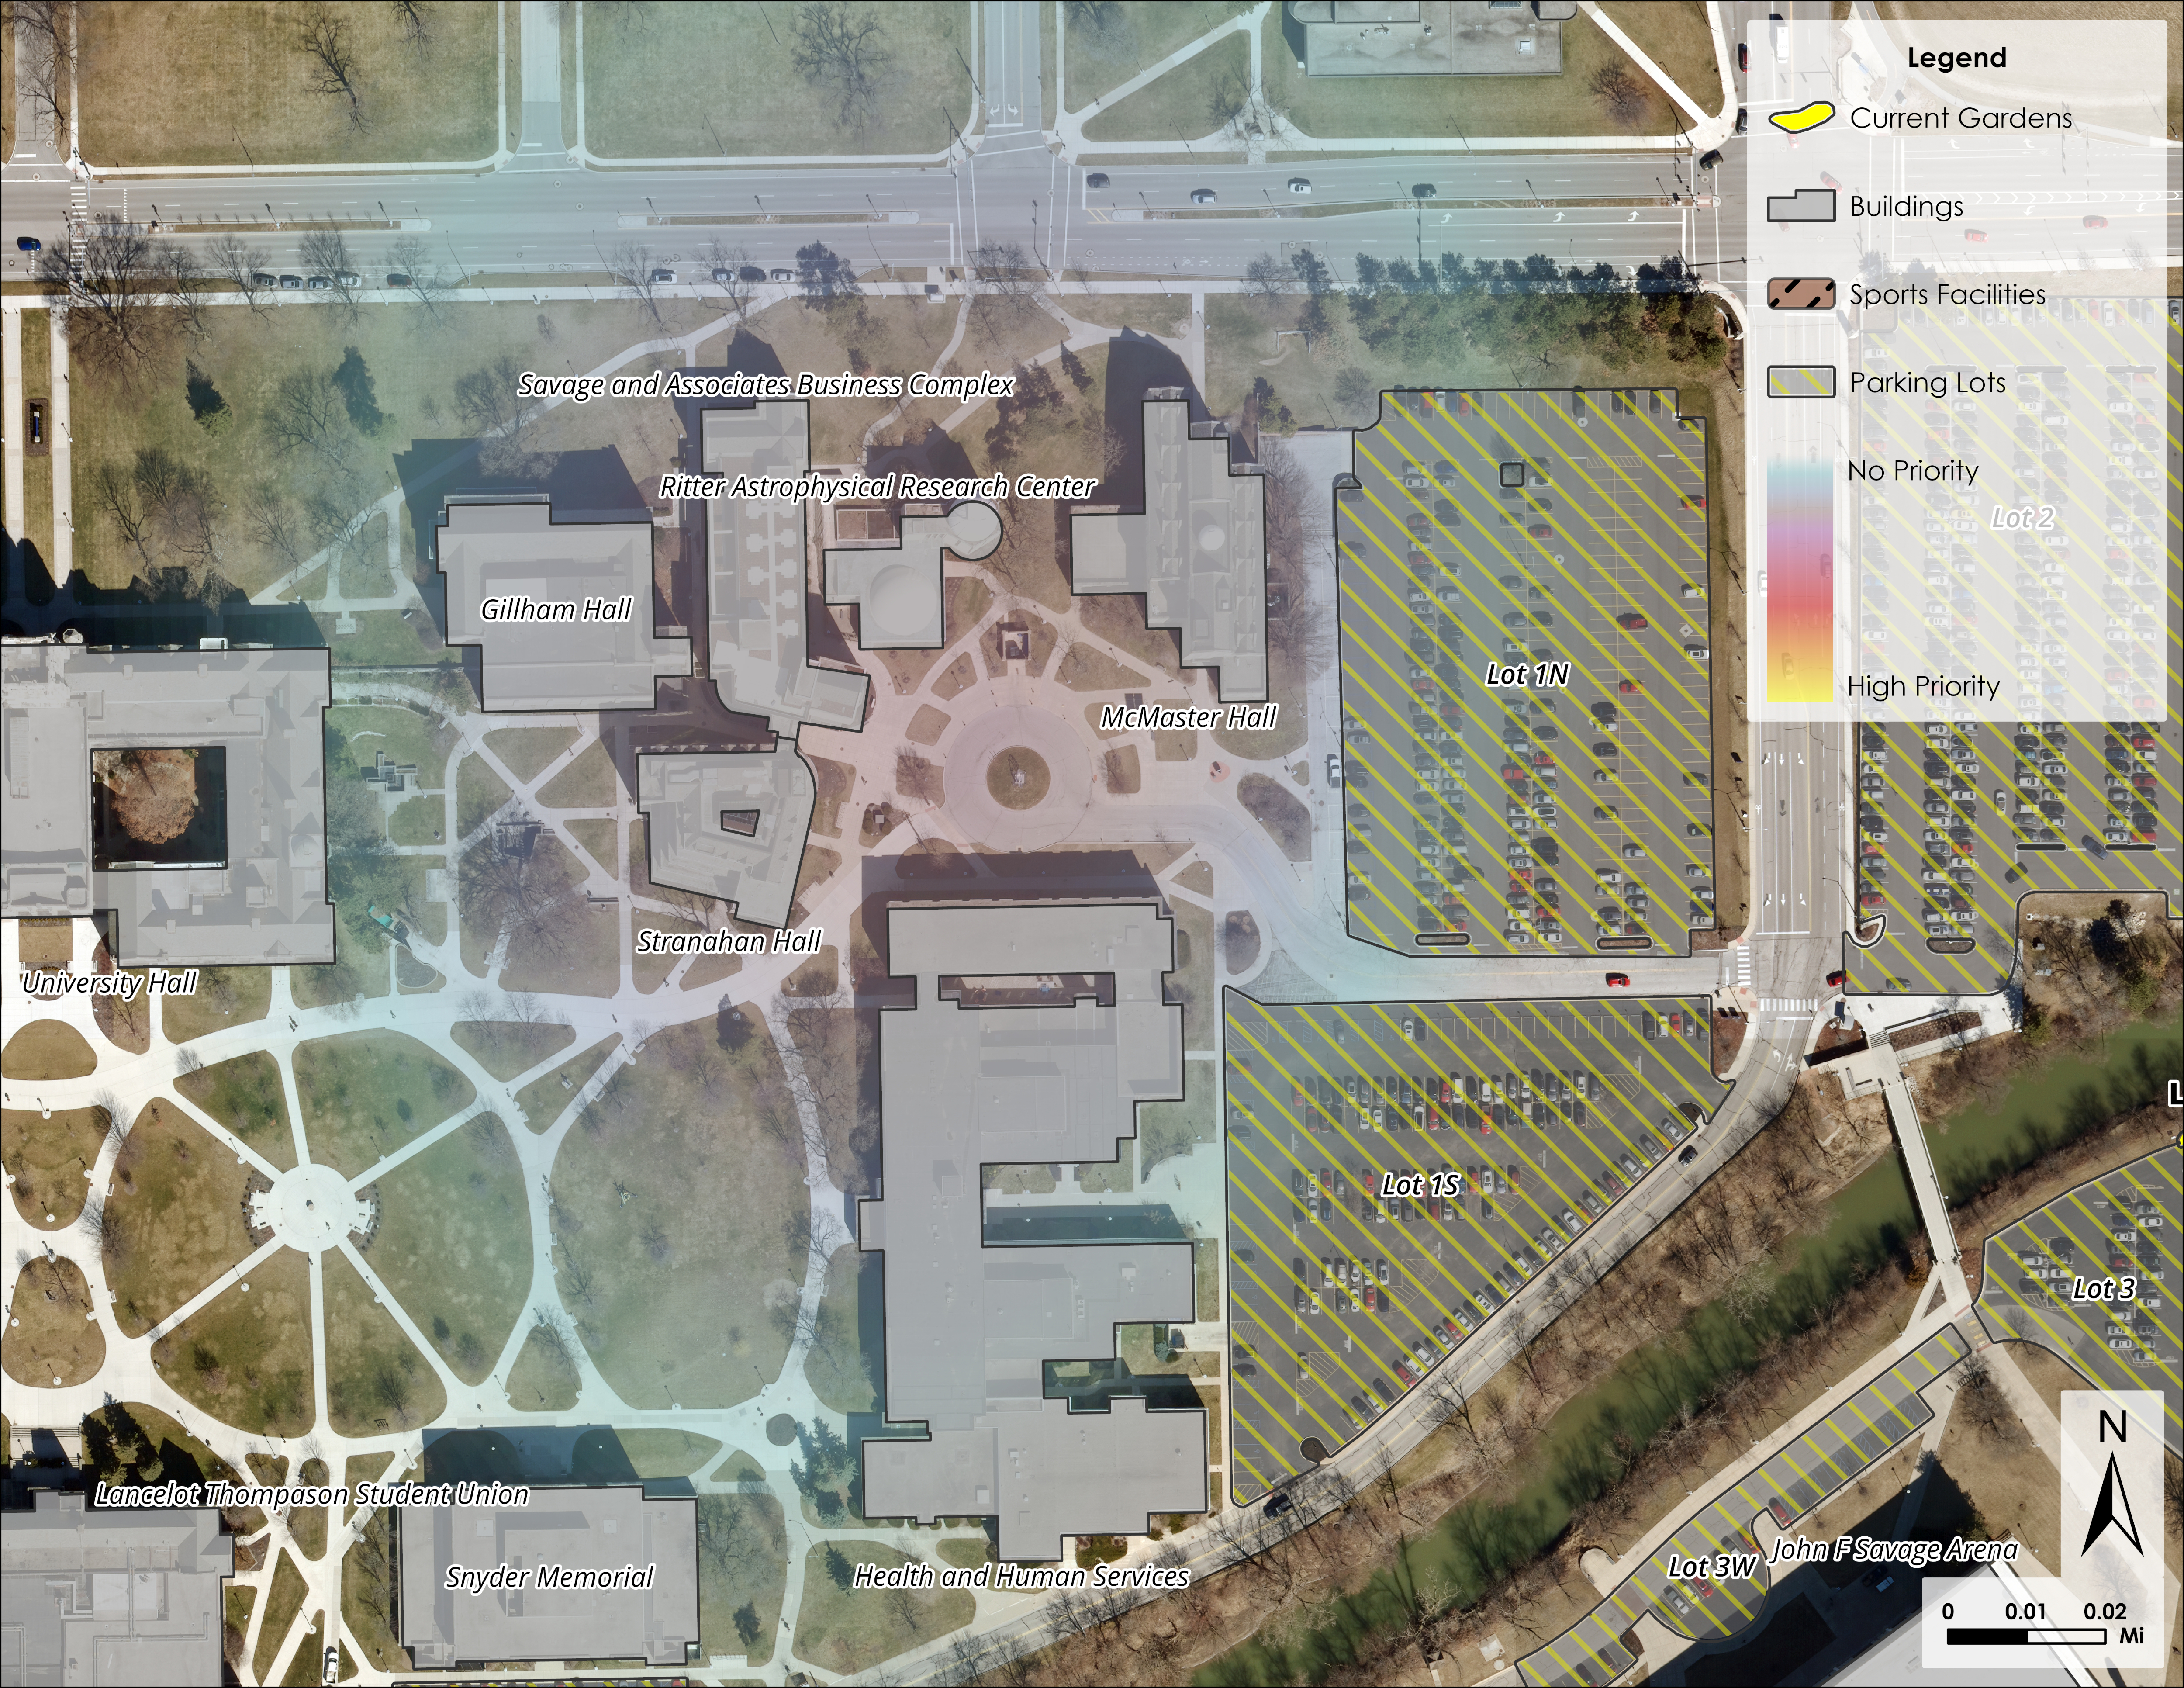
Figure 3. Heatmap of the Ritter / Stranahan area on the NE end of campus.
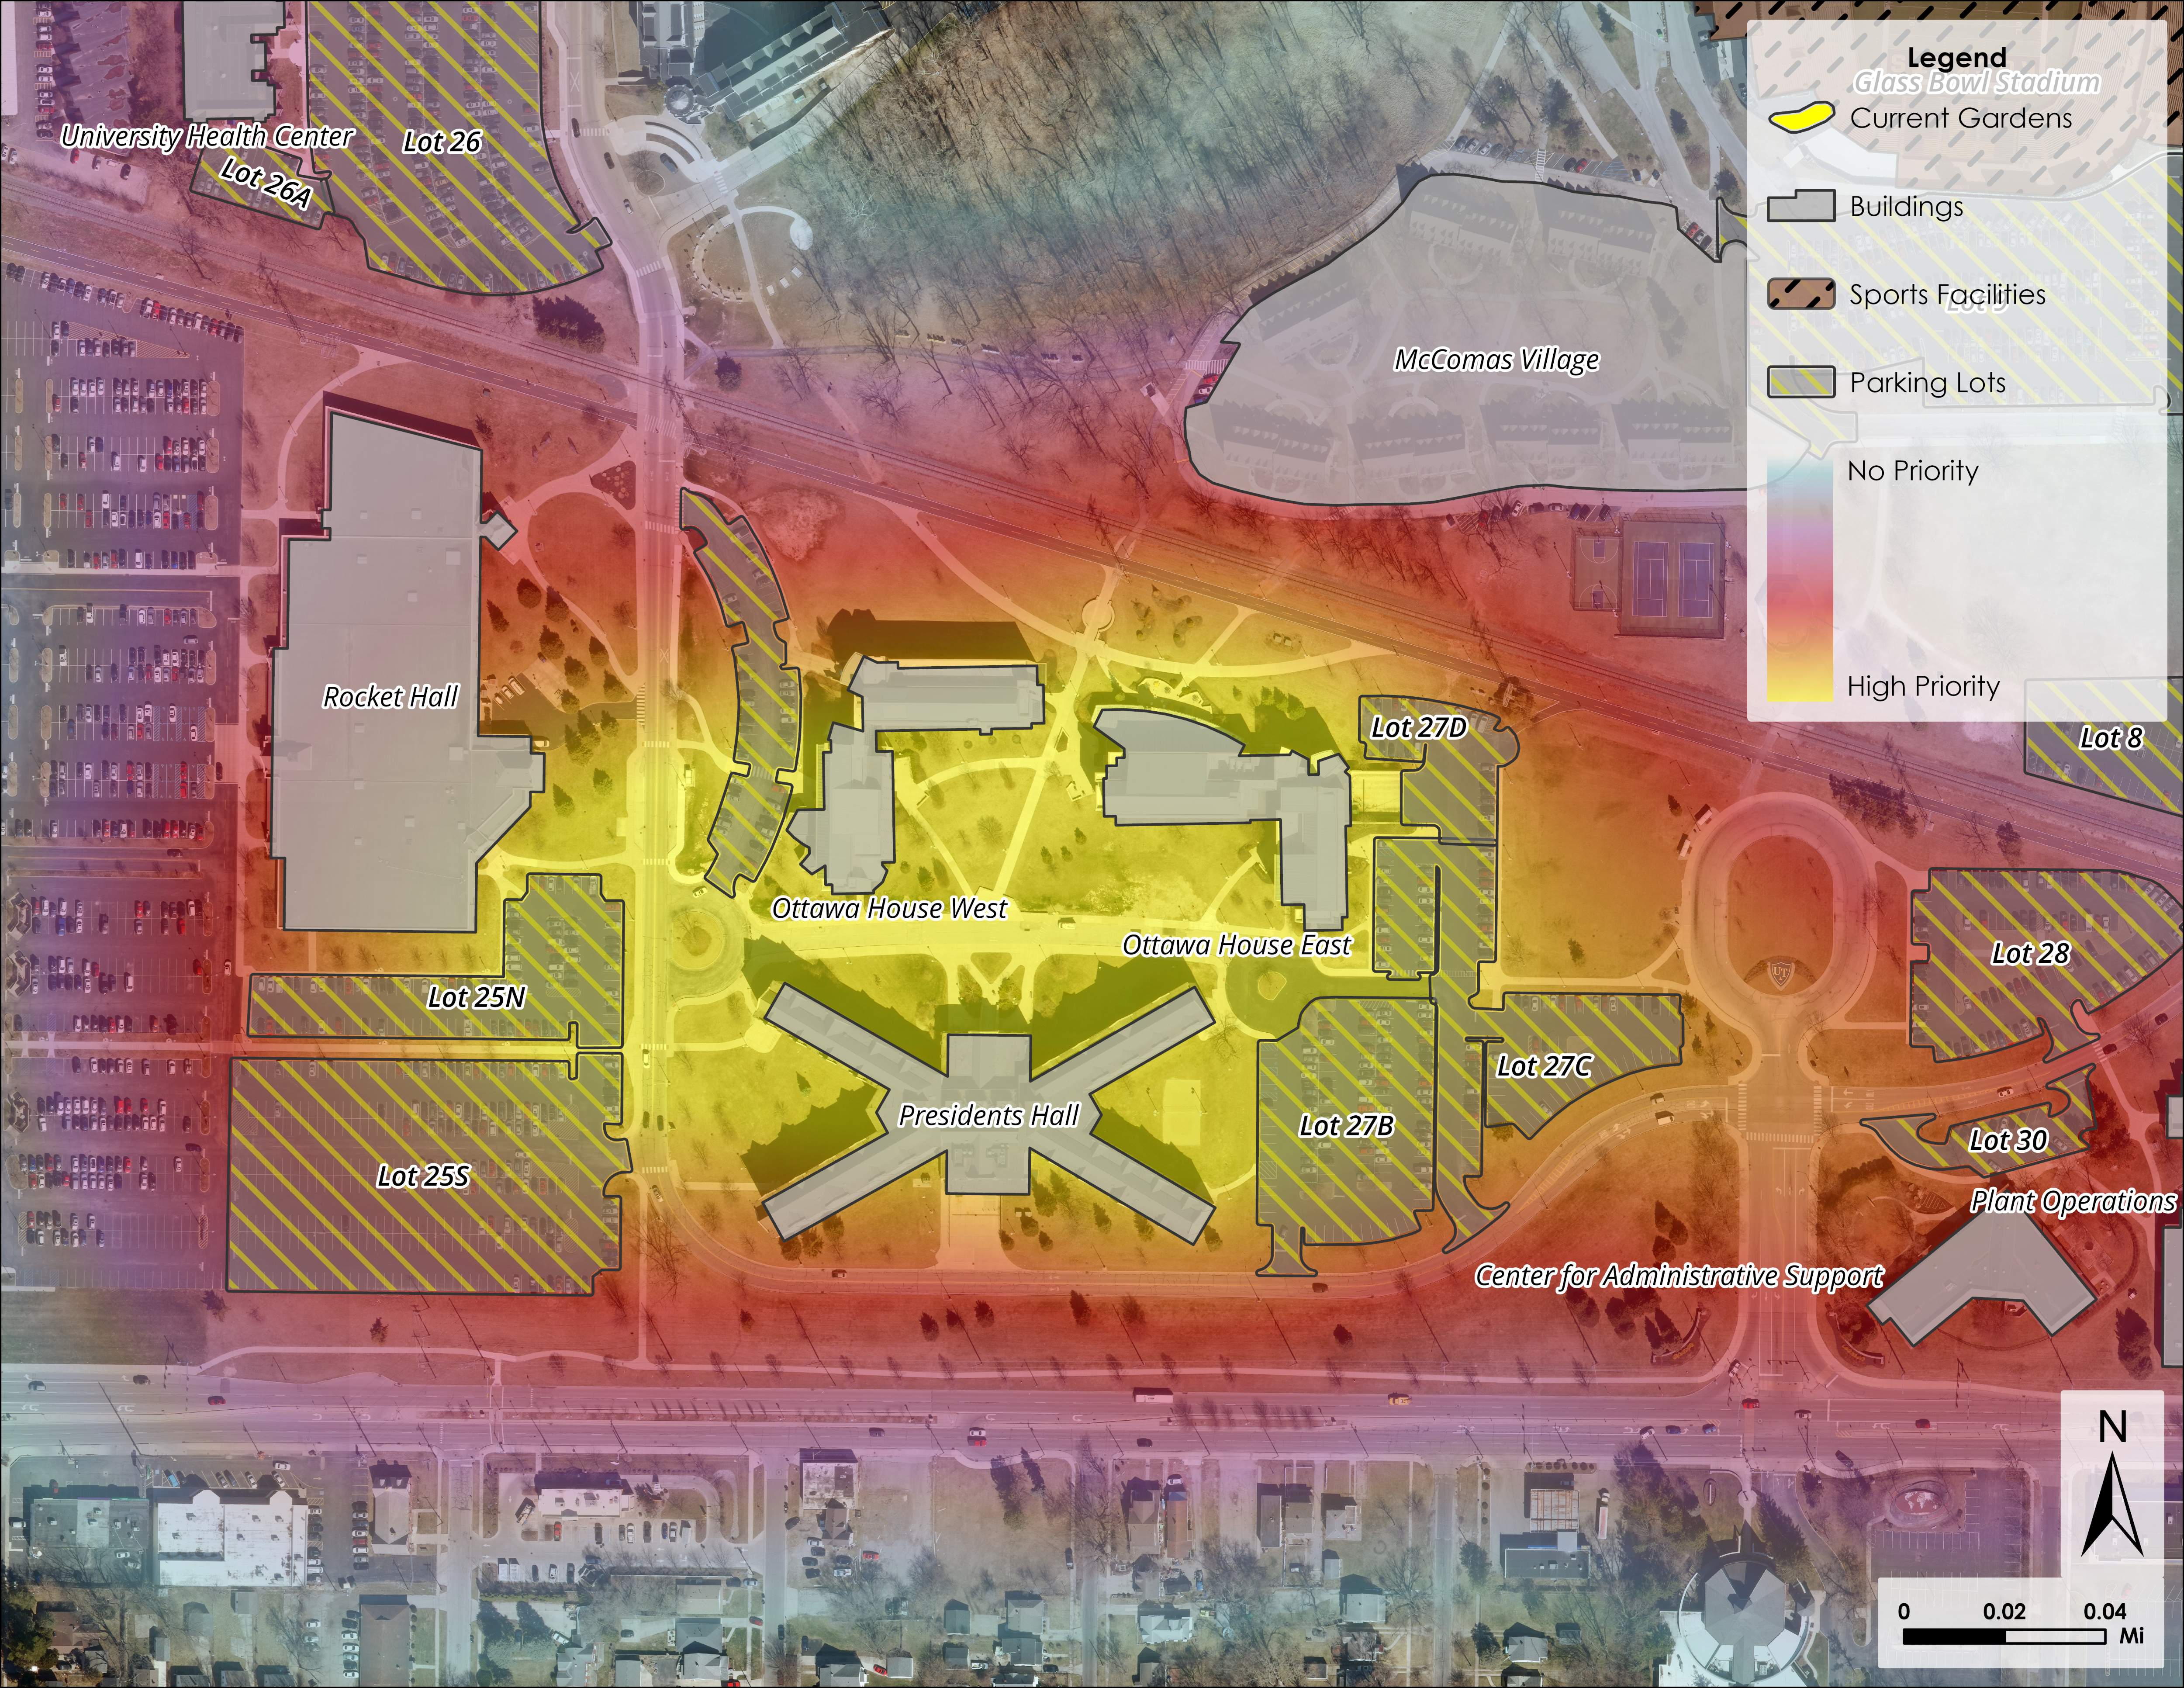
Figure 4. Heatmap of the Presidents Hall / McComas Village / Ottawa House area on the SW end of campus. This area shows the highest priority for a future GUTS installation.
(Not included on poster)
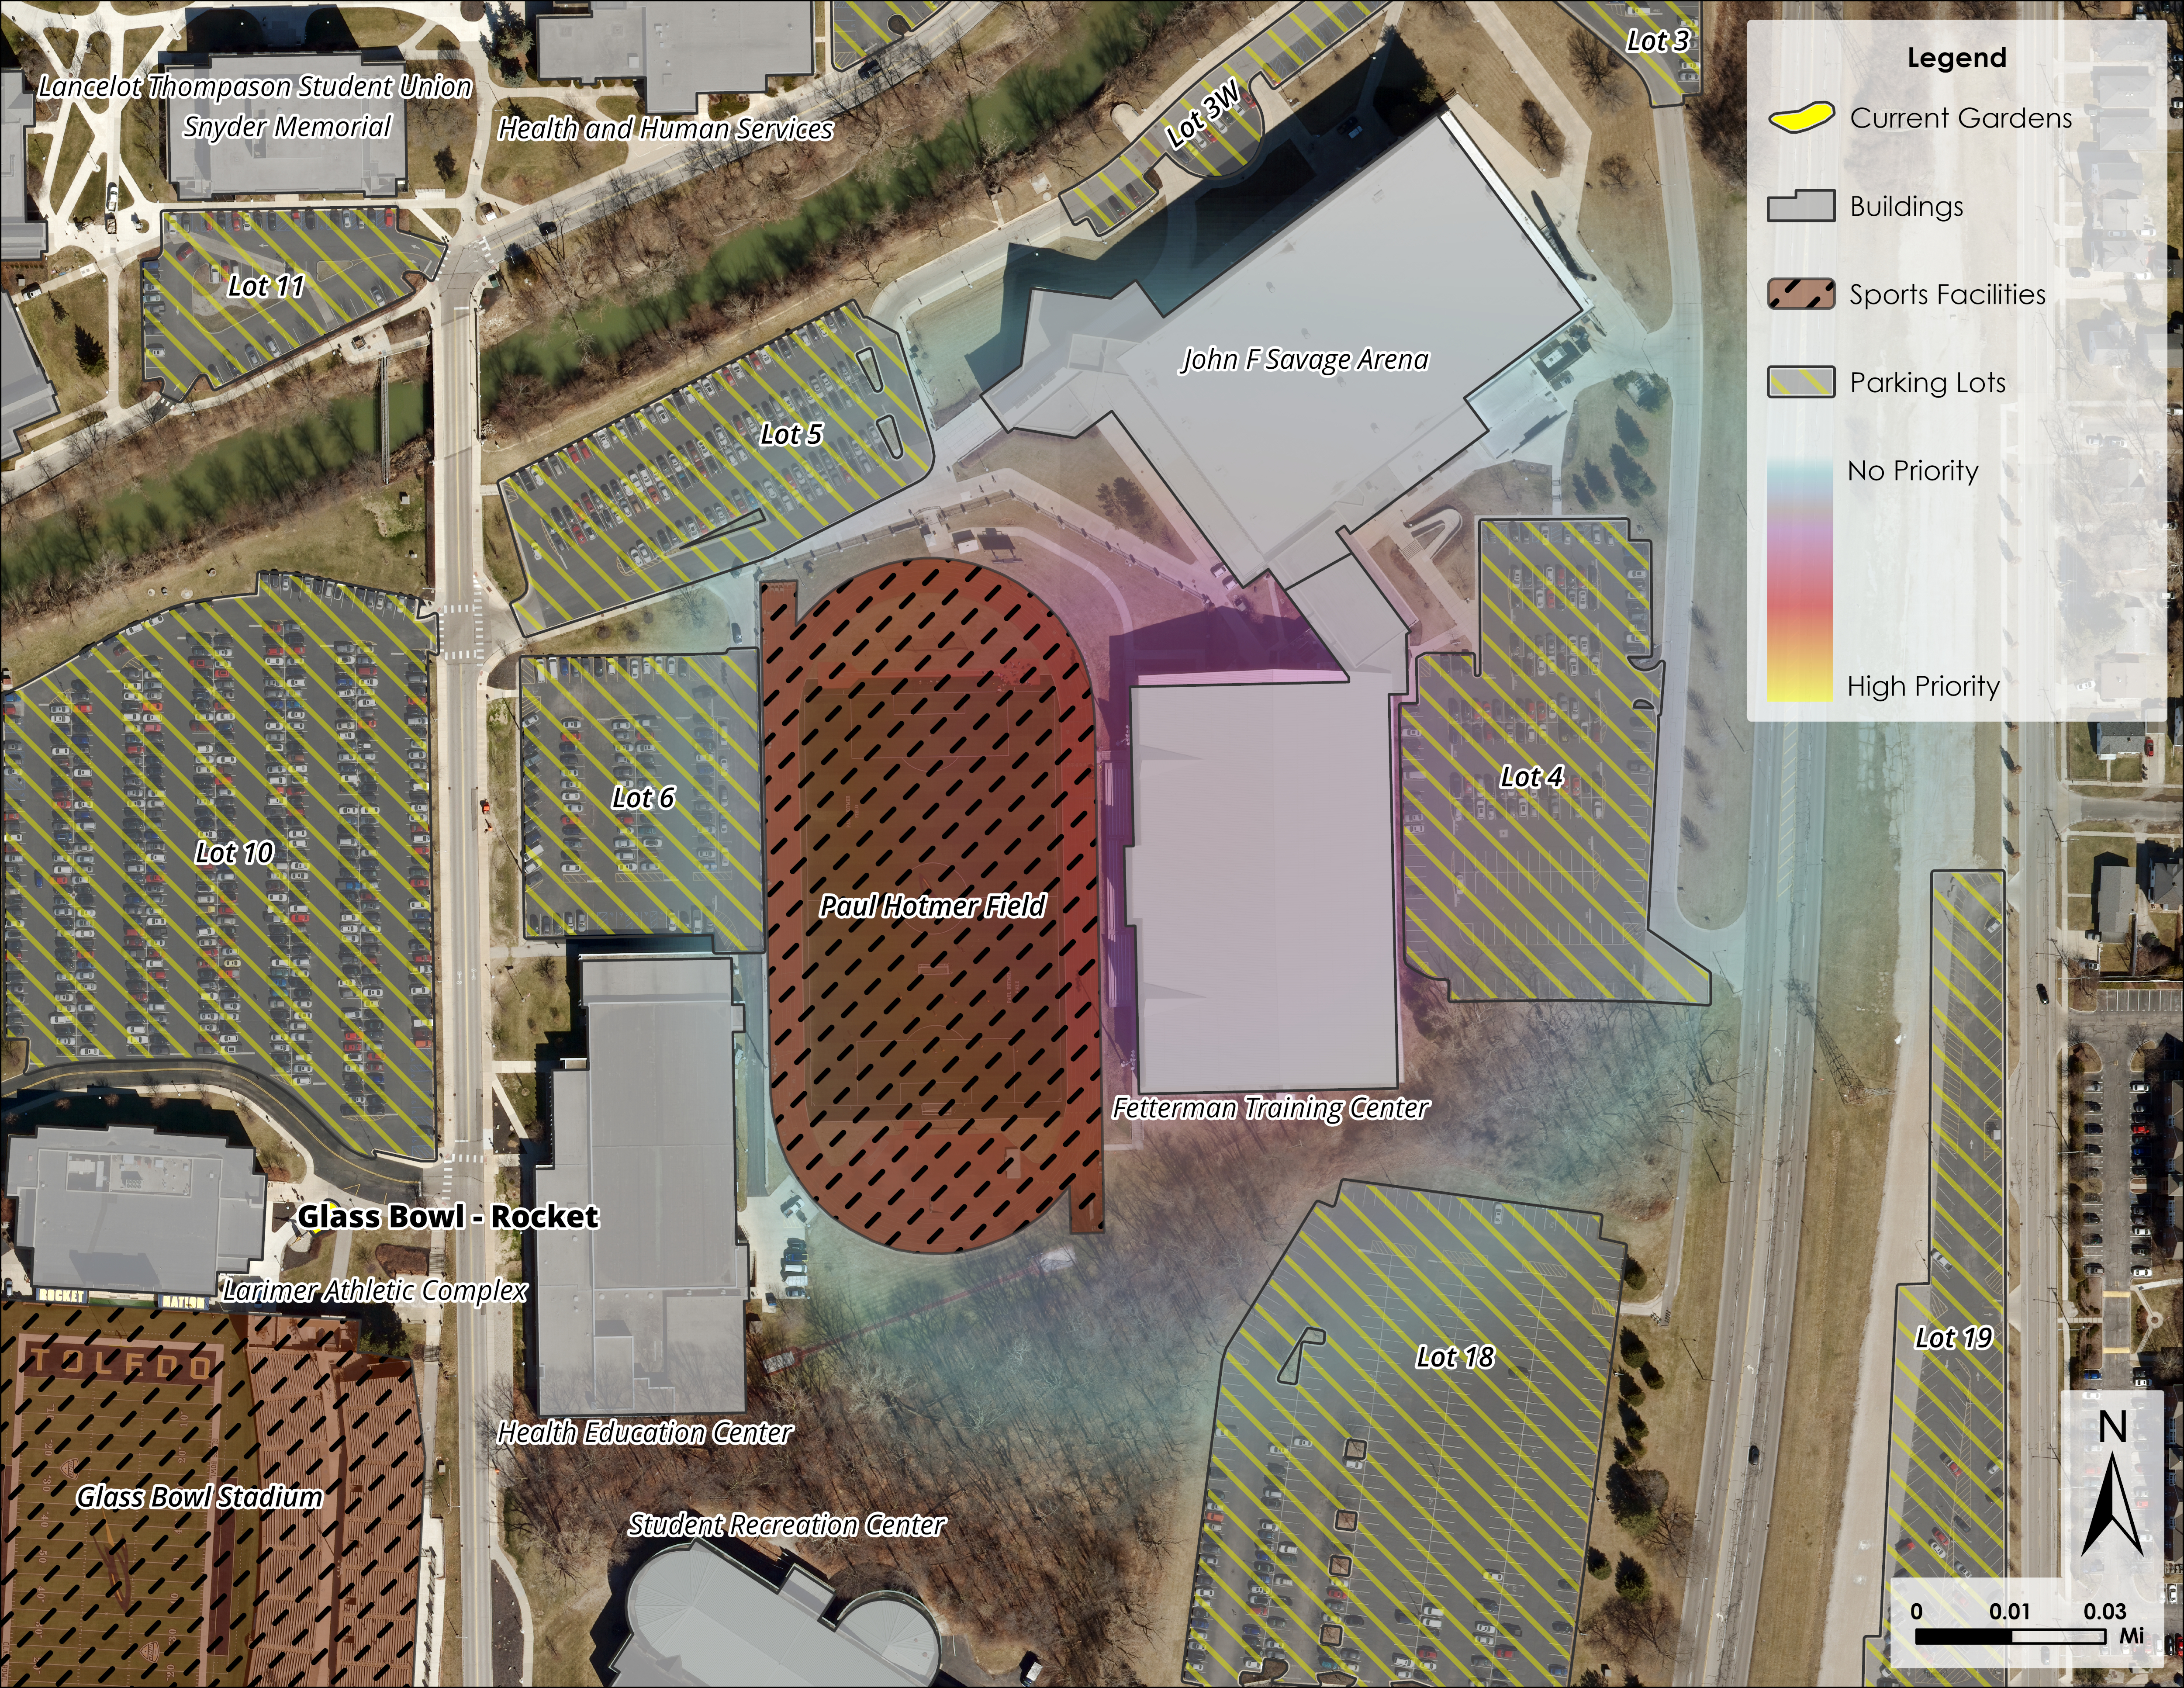
Figure 5. Heatmap of Paul Hotmer Field and John F. Savage Arena.
(Not included on poster)
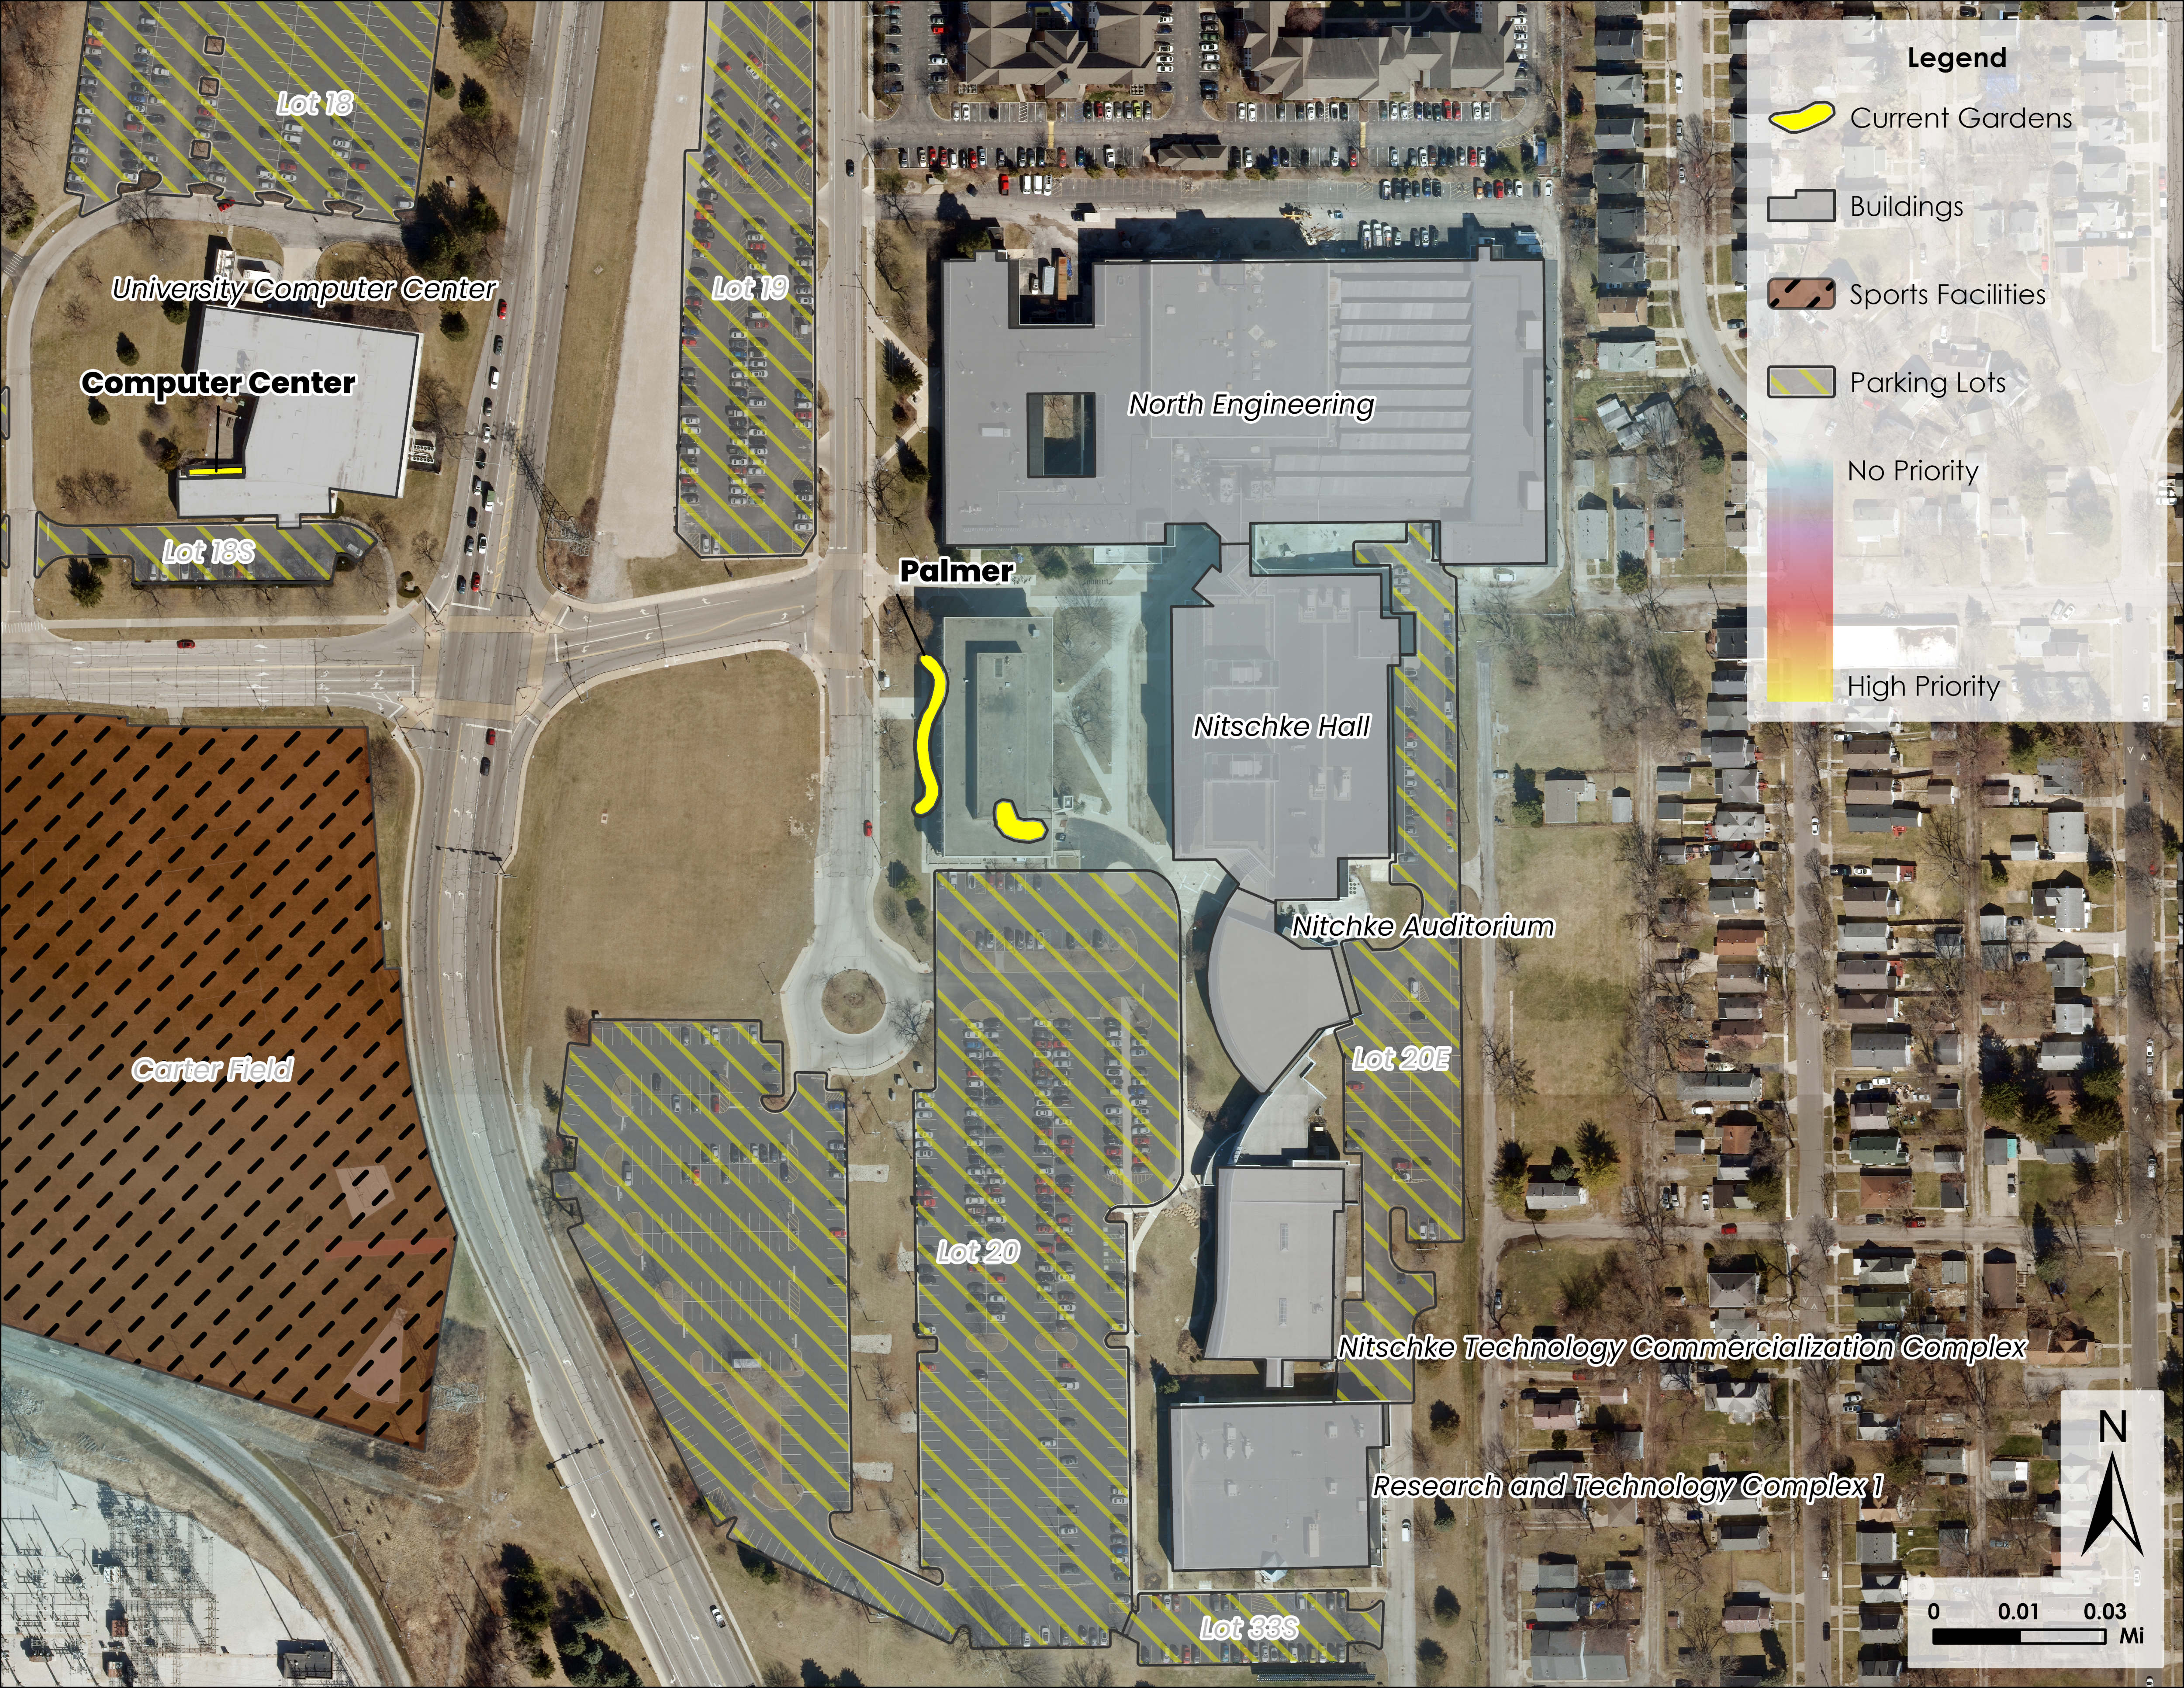
Figure 6. Heatmap of Engineering.
(Not included on poster)
Figure 7. Average Weights by Building. Each building on campus with its corresponding weight. The scale for buildings is -5-5 and is determined by averaging the distance to the closest garden and the capacity of the building.
(Not included on poster)
Figure 8. Average Weights by Parking Lot. Each parking lot on campus with its corresponding weight. The scale for parking lots is -5-5 and is determined by averaging the distance to the closest garden and the size of the lot.
(Not included on poster)
Figure 9. Average Weights by Sports Facility. Each sports facility on campus with its corresponding weight. The scale for sports facilities is -5-5 and is determined by averaging the distance to the closest garden and the weight manually applied.
(Not included on poster)
Figure 10. Average Weights - Combined. Every building, parking lot, and sports facility on campus with its corresponding weight. The scale for all is -5-5.

(Not included on poster)
Figure 11. Animated GIF of hypothetical garden installations where hotspots dynamically change on the heatmap to highlight new areas in need of installations.
(Not included on poster)
Figure 12. Graphic of the Weighted Suitability Model workflow.
Table 1. Building data showing the assigned arbitrary weight, the capacity of the building if capacity data was given, the weight assigned based on capacity, the arbitrary weight or capacity weight (whichever is higher), the distance weight calculated by the distance to the nearest garden, and the average of all weights for the final weight which is used for the heatmap.
(Not included on poster)
| Name | Weight | Capacity | Capacity_Weight | Weight_or_Capacity_Weight | Distance_Weight | Average_Weight |
|---|---|---|---|---|---|---|
| Bowman-Oddy | 989 | 3.206358059 | 3.206358059 | -5 | -0.89682097 | |
| Carlson Library | 5 | 5 | -5 | 0 | ||
| Center for Administrative Support | 1 | 1 | 5 | 3 | ||
| Center for Performing Arts | 914 | 3.039040714 | 3.039040714 | -4.940590098 | -0.950774692 | |
| Fetterman Training Center | 2 | 2 | -0.098228587 | 0.950885706 | ||
| Gillham Hall | 458 | 2.021751255 | 2.021751255 | -2.738003978 | -0.358126362 | |
| Health and Human Services | 829 | 2.849414389 | 2.849414389 | -0.663250326 | 1.093082032 | |
| Health Education Center | 401 | 1.894590073 | 1.894590073 | -3.803908444 | -0.954659186 | |
| Honors Academic Village | 5 | 5 | -1.882437216 | 1.558781392 | ||
| John F Savage Arena | 5 | 5 | -2.769544582 | 1.115227709 | ||
| Koester Alumni Pavilion | 5 | 5 | -4.275280957 | 0.362359522 | ||
| Lancelot Thompson Student Union | 5 | 5 | -4.900083221 | 0.04995839 | ||
| Larimer Athletic Complex | 2 | 320 | 1.71388734 | 2 | -4.74008676 | -1.37004338 |
| Law Center | 770 | 2.717791411 | 2.717791411 | -2.436035536 | 0.140877938 | |
| Libbey Hall | 5 | 5 | -2.13514903 | 1.432425485 | ||
| Mackinnon Hall | 74 | 1.165086447 | 1.165086447 | -3.626821713 | -1.230867633 | |
| McComas Village | 5 | 5 | -1.208188727 | 1.895905637 | ||
| McMaster Hall | 226 | 1.504182934 | 1.504182934 | -0.09388762 | 0.705147657 | |
| Memorial Field House | 1049 | 3.340211935 | 3.340211935 | -3.363620574 | -0.011704319 | |
| Nitschke Auditorium | 5 | 1003 | 3.23759063 | 5 | -3.697829157 | 0.651085421 |
| Nitschke Hall | 5 | 471 | 2.050752928 | 5 | -4.141955084 | 0.429022458 |
| Nitschke Technology Commercialization Complex | 2 | 2 | -2.50193607 | -0.250968035 | ||
| North Engineering | 1793 | 5 | 5 | -4.257882426 | 0.371058787 | |
| Ottawa House East | 5 | 5 | 2.36343514 | 3.68171757 | ||
| Ottawa House West | 5 | 5 | 2.104556688 | 3.552278344 | ||
| Parks Tower | 5 | 30 | 1.066926938 | 5 | -4.047898573 | 0.476050713 |
| Plant Operations | 0 | 0 | 3.124592848 | 1.562296424 | ||
| Presidents Hall | 5 | 1 | 1.002230898 | 5 | 4.453523346 | 4.726761673 |
| Research and Technology Complex 1 | 69 | 1.153931958 | 1.153931958 | -1.101483798 | 0.02622408 | |
| Ritter Astrophysical Research Center | 3 | 130 | 1.290016732 | 3 | -0.902345364 | 1.048827318 |
| Rocket Hall | 980 | 3.186279978 | 3.186279978 | 2.48584005 | 2.836060014 | |
| Savage and Associates Business Complex | 743 | 2.657557167 | 2.657557167 | -1.513321047 | 0.57211806 | |
| Snyder Memorial | 604 | 2.347462354 | 2.347462354 | -2.625826708 | -0.139182177 | |
| Stranahan Hall | 608 | 2.356385945 | 2.356385945 | -1.880331985 | 0.23802698 | |
| Student Recreation Center | 5 | 53 | 1.118237591 | 5 | -3.160455121 | 0.919772439 |
| Tucker Hall | 5 | 5 | -1.499804285 | 1.750097857 | ||
| University Computer Center | 1 | 1 | -4.985897577 | -1.992948788 | ||
| University Hall | 1717 | 4.830451757 | 4.830451757 | -5 | -0.084774122 | |
| University Health Center | 3 | 3 | 1.183318082 | 2.091659041 | ||
| Varsity "T" Pavilion | 5 | 5 | -4.665299758 | 0.167350121 | ||
| Wolfe Hall | 894 | 2.994422755 | 2.994422755 | -5 | -1.002788622 |
Download (.xlsx, 12.2 KB)
Table 2. Sports facilities data showing the assigned arbitrary weight, the distance weight calculated by the distance to the nearest garden, and the average of all weights for the final weight which is used for the heatmap.
(Not included on poster)
| Name | Weight | Distance_Weight | Average_Weight |
|---|---|---|---|
| Carter Field | 1 | 1.181870917 | 1.090935459 |
| Glass Bowl Stadium | 3 | -4.205087301 | -0.602543651 |
| Paul Hotmer Field | 1 | 5 | 3 |
| Tennis Courts | 2 | -4.542195128 | -1.271097564 |
Download (.xlsx, 8.63 KB)
Table 3. Parking lot data showing the parking lot size and associated weight, distance weight calculated by the distance to the nearest garden, and the average of all weights for the final weight which is used for the heatmap.
(Not included on poster)
| Name | Parking_Lot_Area | Parking_Lot_Size_Weight | Distance_Weight | Average_Weight |
|---|---|---|---|---|
| Lot 1N | 89043.556010 | 2.367372 | -2.700700 | -0.166664 |
| Lot 1S | 69961.734350 | 2.046396 | -2.979712 | -0.466658 |
| Lot 2 | 125057.859400 | 2.973168 | -4.192439 | -0.609635 |
| Lot 3 | 40174.045820 | 1.545338 | -4.997868 | -1.726265 |
| Lot 3W | 15086.138150 | 1.123334 | -3.683690 | -1.280178 |
| Lot 4 | 74910.788750 | 2.129644 | -0.851443 | 0.639101 |
| Lot 5 | 50916.902790 | 1.726043 | -1.634619 | 0.045712 |
| Lot 6 | 46216.310800 | 1.646975 | -3.148153 | -0.750589 |
| Lot 8 | 45092.542840 | 1.628072 | -0.035036 | 0.796518 |
| Lot 9 | 110816.114300 | 2.733608 | -1.437571 | 0.648019 |
| Lot 10 | 140585.206500 | 3.234354 | -4.672732 | -0.719189 |
| Lot 11 | 25807.951860 | 1.303686 | -3.044829 | -0.870572 |
| Lot 12 | 122061.806300 | 2.922772 | -3.832535 | -0.454882 |
| Lot 13 | 172786.965700 | 3.776019 | -4.972825 | -0.598403 |
| Lot 13E | 17501.323700 | 1.163960 | -0.515989 | 0.323985 |
| Lot 13N | 28408.969520 | 1.347437 | -0.607927 | 0.369755 |
| Lot 14 | 12815.075310 | 1.085132 | -3.506332 | -1.210600 |
| Lot 18 | 124198.033600 | 2.958705 | -3.363354 | -0.202325 |
| Lot 18S | 12314.149240 | 1.076706 | -4.679137 | -1.801215 |
| Lot 18W | 7872.162528 | 1.001988 | -3.852473 | -1.425243 |
| Lot 19 | 91631.351940 | 2.410901 | -4.019660 | -0.804380 |
| Lot 20 | 245551.640900 | 4.999994 | -4.794693 | 0.102651 |
| Lot 20E | 52678.892480 | 1.755682 | -3.026431 | -0.635375 |
| Lot 25N | 34858.720110 | 1.455928 | 3.923567 | 2.689748 |
| Lot 25S | 96174.707670 | 2.487325 | 5 | 3.743662 |
| Lot 26 | 94067.547320 | 2.451880 | -1.174188 | 0.638846 |
| Lot 26A | 7754.008909 | 1.000001 | 1.640079 | 1.320039 |
| Lot 27A | 21286.639340 | 1.227633 | 1.235651 | 1.231642 |
| Lot 27B | 43267.973900 | 1.597381 | 3.880992 | 2.739186 |
| Lot 27C | 46895.782080 | 1.658404 | 2.826497 | 2.242450 |
| Lot 27D | 15366.191250 | 1.128045 | 1.834814 | 1.481429 |
| Lot 28 | 42060.050300 | 1.577062 | 2.006555 | 1.791809 |
| Lot 30 | 9803.364752 | 1.034472 | 3.208308 | 2.121390 |
| Lot 33S | 12812.356800 | 1.085087 | -0.291774 | 0.396656 |
Download (.xlsx, 12.1 KB)